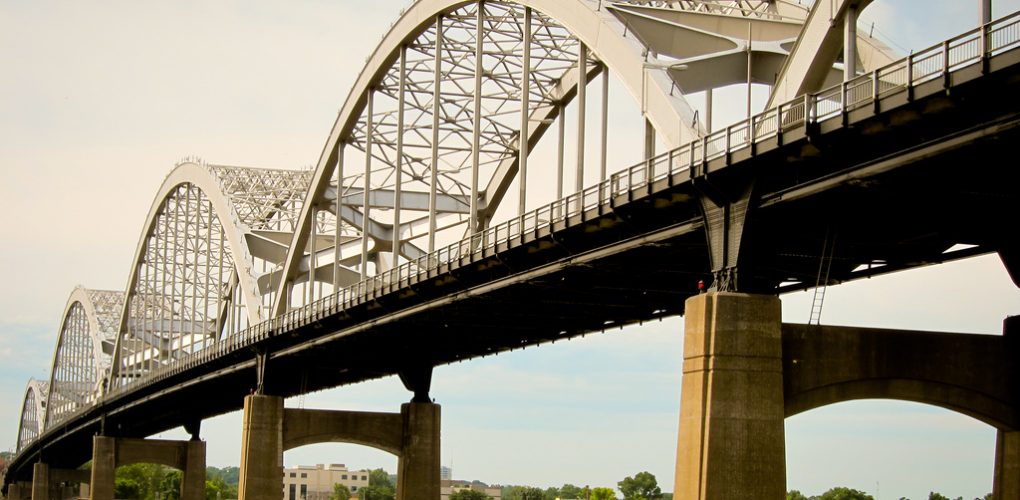
Did your state make the list?
According to a report released last year by the American Society of Civil Engineers, one out of every 11 bridges in the United States is rated structurally deficient.
Federal guidelines define a structurally deficient bridge as one that has one or more critical components, such as the superstructure, substructure or deck, earning a rating after inspection of four or less out of a possible 10. A rating this low indicates that engineers have found one or more major defects.
Structurally deficient bridges are not necessarily unsafe, but they require significant repairs or improvements — or complete replacement — to handle current traffic demands. In some cases, a deficiency forces states and local municipalities to post speed or weight limits on the vehicles allowed to cross them.
In short, structurally deficient bridges no longer meet the original standards for which they were designed and from an engineering standpoint, have failed inspection.
While the overall percentage of bridges in the United Stated rated deficient has gone down slightly over the last decade, there are still more than 56,000 that must be upgraded to be structurally sound.
Did you know: There are 614,387 bridges in the United States? Almost 40 percent of them are a half-century old or older and have reached, or are nearing, the end of their design lives.
The poor state of bridges in the U.S. presents a great opportunity for contractors that specialize in bridge development and repair work, especially if the government infrastructure spending that has recently been discussed becomes a reality. This funding will speed repair activity. Without added government money or cash supplied through public private partnerships, it could take approximately 30 years to complete the current backlog of repairs needed on all the deficient bridges in the United States.
Interesting fact: Estimates pin the cost of rehabilitating the nation’s bridges at $123 billion, which could drive a lot of business to specialized bridge contractors.
Unfortunately, bridge construction and development opportunities are not distributed equally across the U.S. Some states, such as Arizona, Nevada, Texas, and Florida, have a relatively low proportion of deficient bridges (less than 3 percent). Others have much higher rates.
Here is a list of the top 15 states, in reverse order, with the highest percentage of deficient bridges, along with information about the most heavily trafficked vulnerable bridges in each state.
15. New York
Although New York State has made progress improving its infrastructure over the last decade, it still made the list, with 11 percent of its bridges rated as structurally deficient. Of the more than 17,000 bridges in the state, almost 2,000 require significant repairs to make them structurally sound. On top of that, more than 4,500, approximately 25 percent, are classified as functionally obsolete, which means they do not meet current design standards. Overall, 884 New York bridges are posted for load, which limits the size and weight of the vehicles allowed to cross them.
What has New York done to resolve the state’s infrastructure crisis? Between 2005 and 2014, the federal government provided $17.5 billion for capital improvements on almost 3,500 structures. Over the past 10 years, nearly 1,300 bridges have been built and more than 600 have undergone significant reconstruction.
Current estimates put the cost of repairing the rest of New York’s bridges at $75 billion.
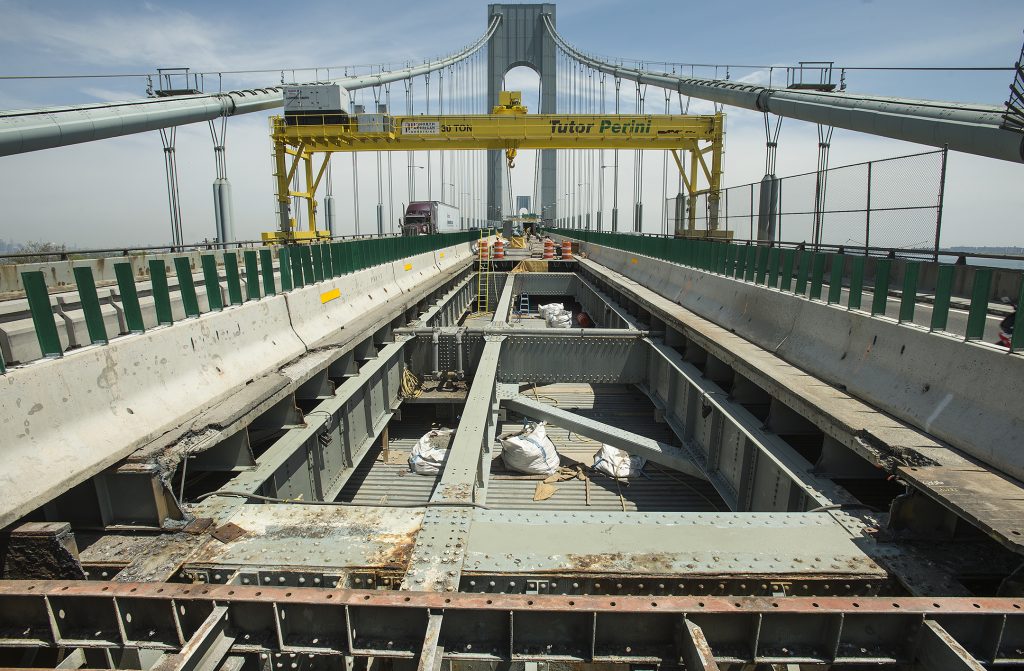
Upper deck of the Verrazano Bridge undergoing renovation.
Did you know: The Verrazano Bridge, connecting Staten Island with Brooklyn, is the busiest in New York State that’s rated structurally deficient? It was completed in 1961 and carries, on average, more than 175,000 vehicles every day.
14. Michigan
Next up on the list is Michigan, where 11.1 percent of bridges are deficient. In that state, which has just over 11,000 bridges, more than 1,200 earned that rating. Poor economic conditions in the region over the last few decades have made it challenging to maintain infrastructure.
The Michigan bridge most in peril? The Second Boulevard Bridge over Highway I-94 in Detroit. It was completed in 1954 and almost 150,000 vehicles cross it daily.
The good news: Some initial progress is being made on rehabbing Detroit’s bridges. Fourteen that are part of a local interstate are currently undergoing repairs as part of a larger road upgrade initiative.
13. New Hampshire
New Hampshire is famous for its picturesque covered bridges. However, the state is also becoming known for the poor condition of the viaducts that make up its transportation infrastructure.
Of the almost 2,500 bridges in New Hampshire, just over 300 (12.2 percent) are structurally deficient. Experts believe the most vulnerable bridge in the state is one that moves traffic on I-293/NH 3A/Everett Turnpike over the North Branch of the Piscataquog River.
Another problem area: Drivers who travel over I-293 in Manchester must cross several overpasses in need of repair, including one over the Piscataquog River, built more than 60 years ago. It carries, on average, approximately 73,000 vehicles per day.
12. Mississippi
Mississippi has just over 17,000 bridges, with almost 2,100 (12.3 percent) requiring significant repairs.
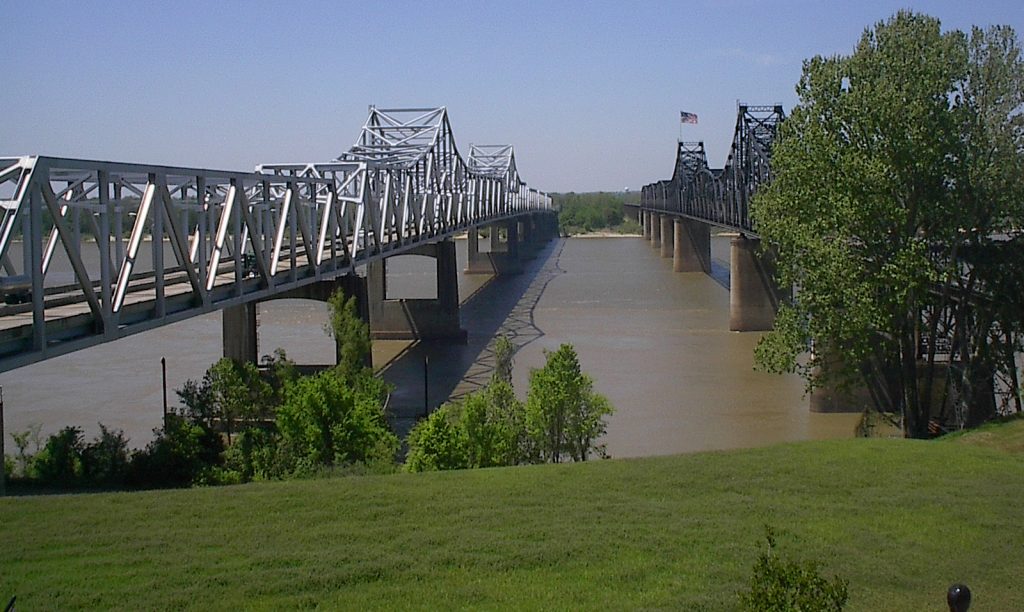
The Vicksburg Bridge is the busiest in Mississippi that’s rated deficient.
One deficient structure, the Vicksburg Bridge, built in 1973, crosses the Mississippi River between Vicksburg, Mississippi, and Delta, Louisiana. More than 27,000 vehicles, on average, travel over it every day.
11. Missouri
Missouri takes the record for having the largest number of bridges of any state on this list. The weight of maintaining such a vast amount of infrastructure strains state and local resources. Of the more than 24,000 overpasses in Missouri, almost 3,200 (13 percent) are structurally deficient.
A single deficient bridge in St Louis, which moves traffic on I-270 E over Conway Road, was built in 1964 and carries a remarkable 193,574 vehicles each day, on average.
10. Louisiana
Of Louisiana’s almost 13,000 bridges, 13.5 percent, or more than 1,700, are structurally deficient.
The most travelled deficient bridge in the state carries 86,400 vehicles on average each day on I-20 over railroad tracks in Shreveport. It’s more than a half-century old. In second place is the I-10 Bridge crossing the Veterans Memorial Highway in Jefferson Parish. Almost 85,000 vehicles travel on it, on average, daily.
9. Maine
For a coastal state, Maine has a relatively small number of bridges. However, 14.4 percent of its 2,450 (just over 350) have serious structural issues. The southbound I-295 viaduct over Route 88 in Yarmouth is the state’s busiest deficient bridge. It was completed in 1959, and more than 26,000 vehicles drive on it, on average, per day.
8. Oklahoma
Of the more than 23,000 bridges in Oklahoma, 15 percent, or almost 3,500, are structurally unsound. Built in 1960, the I-40 Bridge over Crooked Oak Creek in Oklahoma City is the most traveled. More than 87,000 vehicles cross it on the average day.
7. North Dakota
Extreme winter weather takes a toll on North Dakota’s 4,400 bridges. Fifteen percent, or 661, are currently deemed deficient. The busiest carries almost 14,000 vehicles on a typical day on U.S. Highway 10 over the Sheyenne River in West Fargo. The structure recently celebrated its 80th birthday.
6. Nebraska
Of Nebraska’s more than 15,000 viaducts, 15.4 percent, or 2,361, are rated deficient. The U.S. 75 Bridge over J Street in Omaha carries the most traffic with 42,568 vehicles crossing it, on average, per day. It was built in 1970.
5. West Virginia
West Virginia has been hard hit economically over the last several decades, which has significantly impacted the state’s ability to update its infrastructure. Of the state’s 7,217 bridges, 1,247 (15.1 percent) require major repairs.
The busiest structurally deficient bridge in the state moves more than 83,000 vehicles per day, on average, on I-64 over CR 61/12 in Kanawha County. The structure is almost 45 years old.
4. South Dakota
For people traveling the roads of South Dakota, almost one out of every five bridges they cross is structurally deficient. Specifically, 1,147 of the state’s 5,849 overpasses have earned that rating.
The most traveled troubled bridge is in Sioux Falls. It carries, on average, more than 22,000 vehicles per day on West 12th Street over the Ellis & Eastern Railroad. It was constructed back in 1965.
3. Pennsylvania
Pennsylvania has one of the highest percentages of structurally deficient bridges in the U.S.: 19.8 percent. The state maintains 22,791 viaducts, and just over 4,500 of them need significant repairs to get them back into optimal structural condition.
Experts have identified the bridge on the Delaware Expressway over Sergeant and Huntingdon Street in Philadelphia as the state’s most vulnerable. It carries more than 200,000 vehicles per day, on average. Surprisingly, all 10 of Pennsylvania’s busiest structurally deficient bridges are located on a stretch of I-95 in Philadelphia.

A bridge recently under construction on I-95 near Philadelphia.
2. Iowa
For a state with a small population, Iowa has a relatively large number of bridges and an equally big percentage in need of repair. Of the state’s 24,184 overpasses, 4,968 (20.5 percent) are structurally deficient.
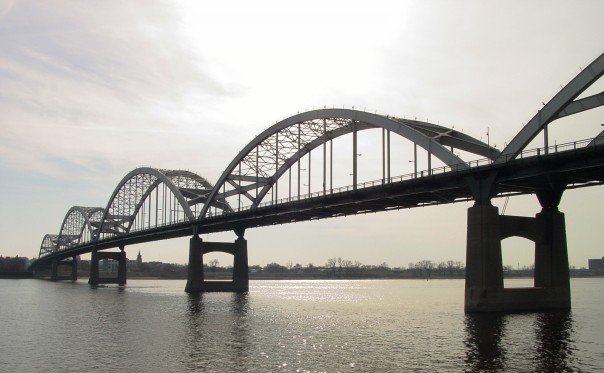
The Centennial Bridge is more than 75 years old and in need of rehabilitation.
The one most in need of improvement is the Centennial Bridge, which connects Davenport, Iowa, with Rock Island, Illinois. Every day, on average, 32,000 vehicles cross the bridge, which was built in 1940.
1. Rhode Island
Rhode Island may be the smallest state, but it has an outsize percentage of deficient bridges. Almost one out of four requires significant repairs. For a state that has has only 772 bridges, almost 200 are considered unsound. This is the third year in a row that Rhode Island has earned the number-one ranking for percentage of structurally deficient bridges.
The Rhode Island bridge most in need of repair carries more than 171,000 vehicles per day, on average, on I-95 over U.S. 6 and the Woonasquatucket River in Providence. It was built in 1964.
According to state estimates, it will cost an estimated $3 billion to make Rhode Island’s bridges structurally sound.

