
According to a recently released report, at the current pace of repair and construction work, it could take 80 years or more to get all structurally deficient bridges in the United States back into good working order.
In a remarkable coincidence, the report from the American Road and Transportation Builders Association (ARTBA), a group that advocates for investing in transportation infrastructure, came out on the same day that a bridge collapsed in Tennessee.
According to the report on deficient bridges, which is based on 2018 data from the Federal Highway Administration, more than 47,000 U.S. bridges are in critical need of repairs.
A top line scan of the data included in the report reveals the scope of the problem:
- Number of bridges in the United States: 616,087.
- Number of structurally deficient bridges: 47,052.
- Percent of bridges that are structurally deficient: 8 percent.
- Number of bridges that require some type of repair: 235,030.
- Percent of bridges that require some type of repair: 38 percent.
- Number of Americans who cross structurally deficient bridges each day: 178 million.
- Average age of structurally deficient bridges: 62 years old.

The iconic Brooklyn Bridge in New York City is an example of a structurally deficient bridge in need of repair.
Moving the goal posts.
The term “structurally deficient” technically means that a bridge needs repairs but hasn’t been deemed unsafe to travel over.
Surprisingly, the number of bridges that meet the standard has seemingly gone down by 7,000 from last year’s report. However, this does not reflect a significant increase in maintenance work. Instead, the reduction is because the Federal Highway Administration (FHWA) changed the standard for what makes a bridge structurally deficient.
By way of background, bridges are regularly inspected and rated for safety on a scale of zero to nine (zero is unsafe, nine is very safe). Prior to the change, a bridge would be classified as structurally deficient if the overall structure was rated four (which is considered poor) or below — or if they did not have sufficient waterway openings.
Today, the standard for classifying a bridge structurally deficient is that one of four key elements of the bridge is rated a four. This new system has eliminated between 6,500 and 7,000 bridges from the list. The condition of the bridges has not changed, merely how they’re evaluated.
Interesting fact: Current estimates show that it could cost more than $170 billion to complete required bridge maintenance and repair work.
Not an isolated issue.
The bridge repair problem isn’t centered in just one part of the country. The numbers show that it’s an issue impacting all parts of the U.S.
The states with the highest number of structurally deficient bridges are:
- Iowa (4,675).
- Pennsylvania (3,770).
- Oklahoma (2,540).
- Illinois (2,273).
- Missouri (2,116).
Looking at this in a slightly different way, the states with the highest percentage of structurally deficient bridges (when compared to their total number of bridges) are:
- Rhode Island (23.0 percent).
- West Virginia (19.8 percent).
- South Dakota (16.7 percent).
- Pennsylvania (16.5 percent).
- Maine (13.1 percent).
Did you know: If placed end to end, the length of all the structurally deficient bridges in the United States would stretch nearly 1,100 miles, from Chicago to Houston?
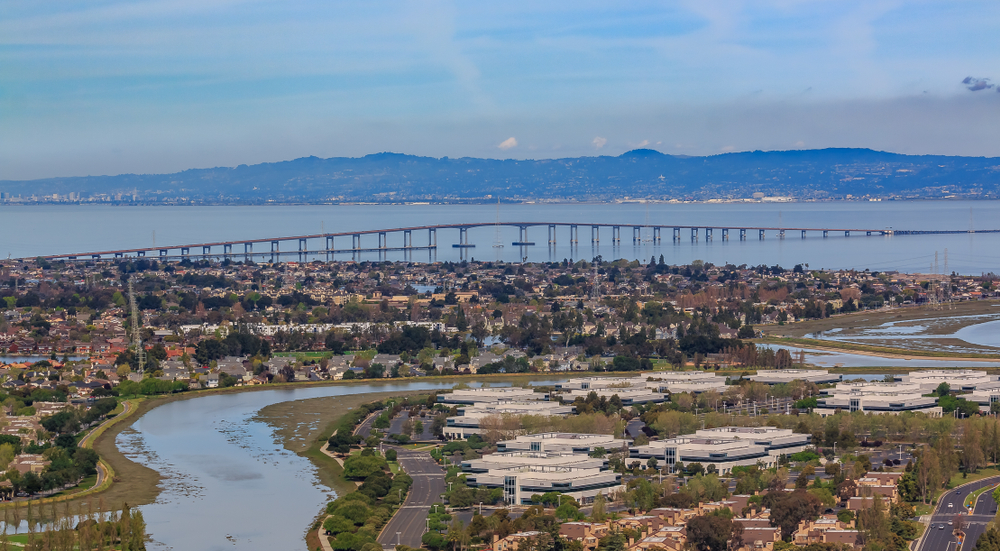
The well-traveled San Mateo-Hayward Bridge over the San Francisco Bay is another structurally deficient bridge.
A surprising change.
Last year’s ARTBA report came to the conclusion that it would take the U.S. approximately 37 years to repair the nation’s bridges, based on the pace that work was getting done in 2017. The estimate has more than doubled to 80 years in this year’s report because work slowed considerably in 2018. In many places, the change is because states are forced to repair pavement on roadways, which puts less priority on bridge maintenance.
This was a significant change because the number of bridges classified as poor has fallen from 11 percent to 8 percent since 2002. The reduction was a result of states responding to the impending bridge crisis. Last year represented a major reversal to that.
Did you know: Four out of 10 bridges in the United States need to be replaced or repaired, including one out of three bridges on the Interstate?
What it all means.
While bridge collapses and failures are still relatively uncommon, the current state of affairs means that drivers will face more bridge closures or weight limits to ensure safety. An example: The Mississippi Department of Transportation recently closed 61 bridges because of unsafe conditions.
These closures and weight limits will make it more difficult for people to get around. It will also have an economic impact because it will make it hard for people to get to work and for deliveries to make it to their destinations.
This all presents a great opportunity for businesses in the bridge maintenance, construction, inspection, and repair industry, especially if Congress and the President can agree on a plan for infrastructure repairs and development, including the funding for it. It is the surest way to reverse this year’s negative news about the state of the nation’s bridges.
